
Means to an Enzo
This system produced a fair bit of snow, but thankfully little drama. A lot of wind and sun, low thermal plant outages, lower demand, and batteries meant there was plenty of supply so far.

In Texas, winter grid challenges are generally tougher than summer ones — summertime peaks are very closely correlated with high solar output, winter peaks are not.
But this winter’s lack of grid drama offers an enticing glimpse of how solar and storage can work in the winter, especially as a complement to nuclear, gas peakers, geothermal, and other forms of power.
Energy people talk about duck curves when discussing summer demand charts. In the winter, you tend to get camel humps, with peaks in the morning and evening. Today is a great example:

Demand drops in the middle day, and this is when solar power produces the most. Even with snow covering much of the state, solar produced around 20,000 megawatts for most of the day.

That’s not uncommon — it was also sunny shortly after Winter Storm Uri’s initial blast in 2021, and we saw similar patterns during Elliott and Heather, and now Enzo.
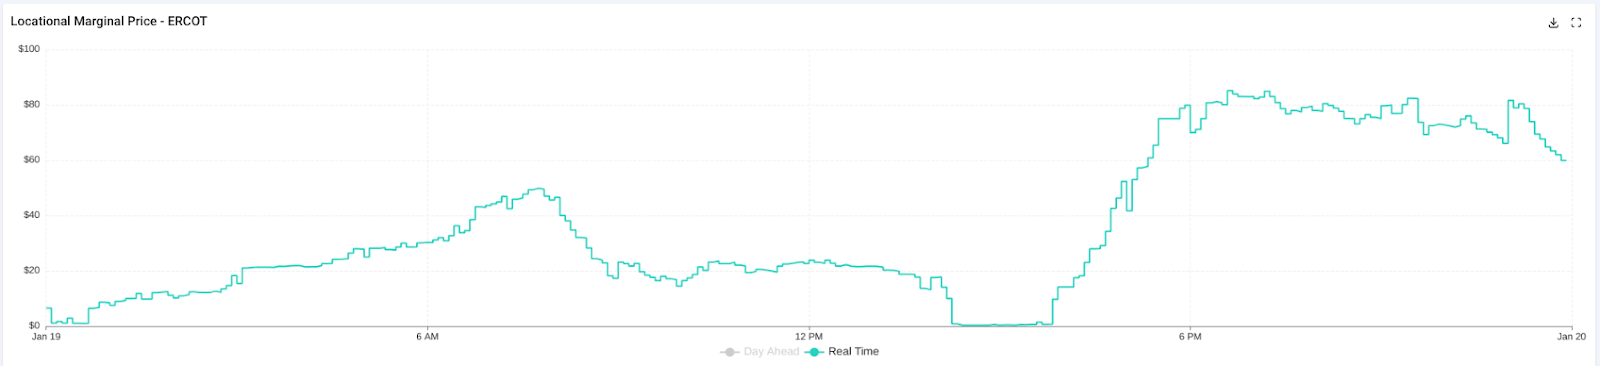
As a result, power prices this afternoon were zero on the Texas wholesale market, even with a statewide average temperature in the 30s and demand high enough to be a record during most months of the year. So batteries discharged to help meet the morning demand peak, then filled up with no-cost electricity all afternoon so they could be ready for evening. Here’s what that looked like two days ago, on January 19, when prices were $0 for nearly two hours and below $30 per MWh for nine hours. The first graph is battery output, the second is wholesale energy prices.

Here’s what I’ve seen so far with this week’s Winter Storm Enzo:
Keep reading with a 7-day free trial
Subscribe to The Texas Energy and Power Newsletter to keep reading this post and get 7 days of free access to the full post archives.